UNI Technical Analysis Apr 28

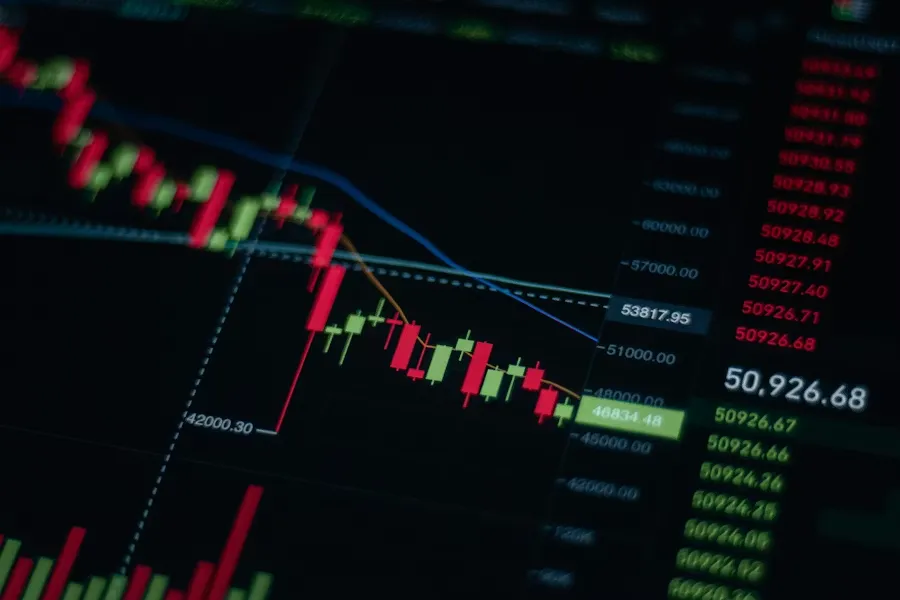
UNI is positioned in the neutral zone with RSI 45.66, while MACD gives a bullish momentum signal with positive histogram; however, short-term downtrend dominates below EMA20 ($3.28) and volume confirmation remains weak.  Trend Status and Momentum Analysis  UNI is currently trading at $3.23 and recorded a slight 1.29% increase over the last 24 hours, staying within the $3.19-$3.26 daily range. The overall trend direction is considered downtrend, as the price is trading below EMA20 ($3.28) and the Supertrend indicator is giving a bearish signal, pointing to $3.68 resistance. From a momentum perspective, the MACDs positive histogram stands out; this indicates underlying bullish pressure is forming, but the dominant bearish configuration of short-term EMAs limits trend strength. Volume is at a moderate $41.77M but does not strongly confirm the price action – signaling that momentum has not yet fully consolidated. In multi-timeframe (MTF) confluence, 6 strong levels were identified across 1D, 3D, and 1W timeframes: 3 supports and 3 resistances prominent on 1D. This structure shows the price struggling to hold around the $3.1882 support but facing difficulty breaking $3.2942 resistance. Although momentum oscillators give mixed signals, the overall picture shows weak downtrend dominance; for a bullish reversal, MACD histogram expansion and bullish

04-29Industry

Ethereum Price To Rally 100% In 2026: Here’s Where It Will Start And End

Ethereums long stretch of sideways movement may be closer to resolution than most market participants expect. A higher time frame analysis shared by a TradingView analyst suggests the current structure is the final stage before a larger expansion that sees the Ethereum price rallying by over 100% in 2026.  This prediction rests on decades of price history that, taken together, present a compelling case. Ethereum has done this before, the structure is intact, and a 100% move from the current price level is possible.  A Six-Year Consolidation Hiding A Bullish Structure  Technical analysis of higher timeframe charts, particularly the monthly candlestick timeframe, shows that Ethereum has spent much of the past six years locked in a wide consolidation range, with repeated failures between $4,500 and $4,900. That range has acted as a ceiling across multiple attempts, consistently attracting selling pressure each time price approaches it.  To understand where Ethereum may be going, a technical analyst known as Phil on the TradingView platform noted that traders must first understand where it has been. Not in weeks or months, but across the full sweep of its market history.  Two moments stand out as structural inflection points on the monthly chart. The first came in early 2017, when

04-29Industry

XRP ETFs Hit Strongest Inflows Since Dec 2025, Near $1.1B Milestone

XRP ETFs Extend Green Streak as Institutional Demand Builds Toward $1.1B Milestone  XRP spot ETFs are gaining steady momentum again, with the latest weekly figures showing investor demand not just returning, but holding firm at elevated levels.  Market analyst X Finance Bull that XRP spot ETFs have logged another green week, continuing a steady trend closely tracked by institutional investors.  Last week saw $15.74M in net inflows, pushing total net assets to about $1.10B, modest on paper, but the real signal is the consistency of inflows holding firm week after week.  Zooming out, the picture looks even clearer. April has already pulled in $81.63 million in net inflows, marking a strong rebound from Marchs $31.16 million outflow.  This reversal makes April the most robust month for XRP ETF inflows since December 2025, signaling a notable shift in momentum.  While this doesnt guarantee immediate price action for XRP, it points to something more structural taking shape. The steady accumulation suggests growing demand for regulated exposure, with investors increasingly favoring ETF structures over direct spot holdings.  In other words, capital is still coming into XRP, but its doing so through more compliant, packaged channels rather than outright market buying.  XRP ETFs Cross $1.08B as Steady Inflows Signal Quiet but Persistent

04-29Industry

UB Price Breakout Gains Steam After OKX Listing Sparks Volatility

The post UB Price Breakout Gains Steam After OKX Listing Sparks Volatility appeared first on Coinpedia Fintech News  The UB price just is on fire in April that many altcoins still dream about, today after a pull back it woke up again, broke resistance, and reminded traders it still has a pulse. Sitting around $0.0537, the move comes right after the OKX perpetual contract listing news, and yes, the timing isnt subtle.  A clean breakout, a leverage catalyst, and suddenly everyones paying attention again.  Resistance finally cracks after months of pressure  For months, the $0.045–$0.048 zone acted like a brick wall. Price poked it, tested it, got rejected and repeat cycle. Until now.  The UB price has finally pushed through that ceiling and, more importantly, closed above it on the daily timeframe. That‘s not just a random spike, basically, it’s a structural shift. Former resistance now flips into support, at least in theory.  But let‘s be real. Breakouts are easy. Holding them? That’s where things get messy.  EMA crossover hints at momentum shift  Now heres where the technical crowd starts nodding.  The 20-day EMA has crossed above the longer-term averages, signaling a clear momentum flip. Short-term trend? Bullish. No debate there.  And price isn‘t just above these EMAs but it’s

04-29Industry

Silver Eyes Lower Prices as Daily Chart Confirms Bearish Setup

Silver (XAG/USD) price slipped to $73.42 on April 28, down 2.78%, as a descending triangle on the daily chart points toward a $68 downside target.  The setup follows a sharp rejection from the all-time high of $121.67 set on January 29. Falling volume and weakening momentum now reinforce the bearish bias across multiple timeframes.  Daily Chart Frames Silver Price Inside Descending Triangle  The daily chart shows silver locked inside a descending triangle that began forming after the January 29 peak. Price now sits near the upper boundary, suggesting another rejection toward the lower band.  Mapping the Fibonacci grid from the $121.67 high to the $54.49 low frames the trade clearly. Silver trades around $73.22, sitting between the 0.5 retracement at $78.93 and the 0.618 level at $68.85.  If the price closes below the upper band, the next bearish target sits at $68. That level aligns with the 0.618 retracement. A larger risk extends to $54.49 at the 0.786 level, which coincides with the triangles lower band.  Resistance sits at $89, capping rebounds at the 0.382 Fibonacci retracement. A close above that level would invalidate the bearish thesis. Such a move would reopen the path toward the $100 target watched earlier this year.  Volume tells a similar story

04-29Industry

Can Pi Network extend 6% rally and reclaim $0.30 next? Examining…

Pi Network [PI] token was up 6.3% in the past 24 hours, compared to the 1.09% slump Bitcoin [BTC] witnessed. The crypto market as a whole saw a 1% decrease in its market cap, making PIs gains stand out.  Source: PI/USDT on TradingView  On the 1-day chart, the bearish long-term trend has not been overthrown. To achieve this, the bulls will need to make new swing lows. As things stand, the $0.2917 resistance level has rebuffed their efforts.  A daily session close above $0.299 is needed to flip the structure bullishly.  The technical indicators on this timeframe signaled a shift toward buying pressure. The CMF climbed back above +0.05 to indicate sizeable capital inflows.  At the same time, the MACD advanced toward the zero line and was about to make a bullish crossover.  The changing buyer pressure and momentum were a healthy sign, but it remains to be seen if the rally can sustain itself.  The lower timeframe PI charts give hope for a rally beyond $0.20Source: PI/USDT on TradingView  The bearish structure (orange) broke into a bullish structure (green) on the H4 chart on Thursday, the 16th of April. Traders plotted a set of Fibonacci retracement levels using the swing move that followed this break.  Over the past

04-29Industry

USD/IDR: Recovery potential after geopolitical de-escalation – OCBC

OCBC strategists Sim Moh Siong and Christopher Wong notes USD/IDR has turned lower with the broader US Dollar (USD) pullback, but says recent Indonesian Rupiah (IDR) softness reflects external uncertainty from a potential prolonged United States (US)–Iran conflict and vulnerability to energy shocks. While concerns persist, the bank sees room for IDR to recover once geopolitical tensions ease and Oil prices decline, with support and resistance levels closely monitored for signs of a deeper pullback.  Geopolitics and energy risk dominate  “USD/IDR turned lower overnight amid broad USD pullback and the uptick in risk sentiments. Irans proposal to US may have partially helped to de-escalate geopolitical uncertainties though oil prices staying higher raises the question if the Monday rebound in oil-sensitive Asian FX, including IDR can be sustained.”  “Overall, the IDR softness this episode reflects external uncertainty tied to the risk of a prolonged US-Iran conflict. Sentiment was further undermined by S&Ps explicit mention that Indonesia is the sovereign most vulnerable in Southeast Asia to a prolonged energy shock.”  “While concerns remain in the interim, we see room for IDR to recover at some point when geopolitical situation de-escalates more meaningfully, alongside oil prices easing. USD/IDR last seen at 17195 levels. Mild bullish momentum on

04-29Industry

Blockchain Association pushes to remove reputation risk from bank supervision

The Blockchain Association is lobbying to eliminate “reputation risk” as a bank supervision criterion, a move that could expand crypto firms access to banking services. The XRP price prediction market for April 2026 is tracking whether this regulatory shift will translate into higher XRP prices, with traders watching the April 30 market for XRP reaching $2.60.  Market reaction  The XRP Price in April market has not resolved, with two days left in the month. Trading volumes sit at $0 face value, meaning no significant liquidity exists yet. Order book depth and actual USDC spent are effectively zero. A single large order could move these markets substantially given the thin activity.  Why it matters  The policy change takes effect June 6, less than two months away. Removing reputation risk as a supervisory tool would make it harder for banks to deny services to crypto companies on subjective grounds. If institutional capital follows the regulatory opening, XRP markets on Polymarket could see rapid repricing. The short timeline between the policy effective date and the April contract expiration creates a compressed window for traders to position.  What to watch  Announcements from the Senate Banking Committee or the SEC on further regulatory changes could move these markets. Increases in XRP

04-29Industry

Can Pi Network extend 6% rally and reclaim $0.30 next? Examining…

Pi Network [PI] token was up 6.3% in the past 24 hours, compared to the 1.09% slump Bitcoin [BTC] witnessed. The crypto market as a whole saw a 1% decrease in its market cap, making PIs gains stand out.  On the 1-day chart, the bearish long-term trend has not been overthrown. To achieve this, the bulls will need to make new swing lows. As things stand, the $0.2917 resistance level has rebuffed their efforts.  A daily session close above $0.299 is needed to flip the structure bullishly.  The technical indicators on this timeframe signaled a shift toward buying pressure. The CMF climbed back above +0.05 to indicate sizeable capital inflows.  At the same time, the MACD advanced toward the zero line and was about to make a bullish crossover.  The changing buyer pressure and momentum were a healthy sign, but it remains to be seen if the rally can sustain itself.  The lower timeframe PI charts give hope for a rally beyond $0.20Source: PI/USDT on TradingView  The bearish structure (orange) broke into a bullish structure (green) on the H4 chart on Thursday, the 16th of April. Traders plotted a set of Fibonacci retracement levels using the swing move that followed this break.  Over the past week, the Pi

04-29Industry

BNB Price Holds Ground as Crypto Falls

BNB price held above $625 on April 28 as the broader crypto market declined, with Bitcoin down 1.6% and Ethereum at a week low, making BNB one of the few large-cap assets to hold its ground during a day driven by stalled Iran ceasefire negotiations and rising oil prices.BNB price fought to hold above $625 on April 28 as the total crypto market cap shed over $30 billion, with most large-cap assets in the red.Binance executed its 35th quarterly auto-burn on April 15, permanently removing 2.14 million BNB worth approximately $1.32 billion from circulation, leaving the total supply below 135 million tokens.The first US-listed 2x leveraged BNB ETF, XBNB from Teucrium, launched on April 25, adding a new institutional access layer to BNBs market structure ahead of the April 28 session.  BNB price was fighting to stay above $625 on April 28 as CryptoPotato reported that most large-cap crypto assets were in the red, with Ethereum below $2,300, XRP below $1.40, and BTC stalling below $77,000. The total crypto market cap shed over $30 billion on the day, but BNBs relative resilience placed it among the better performers in the top ten by market cap, continuing a pattern of outperformance that

04-29Industry
1
...
973975
...
1000