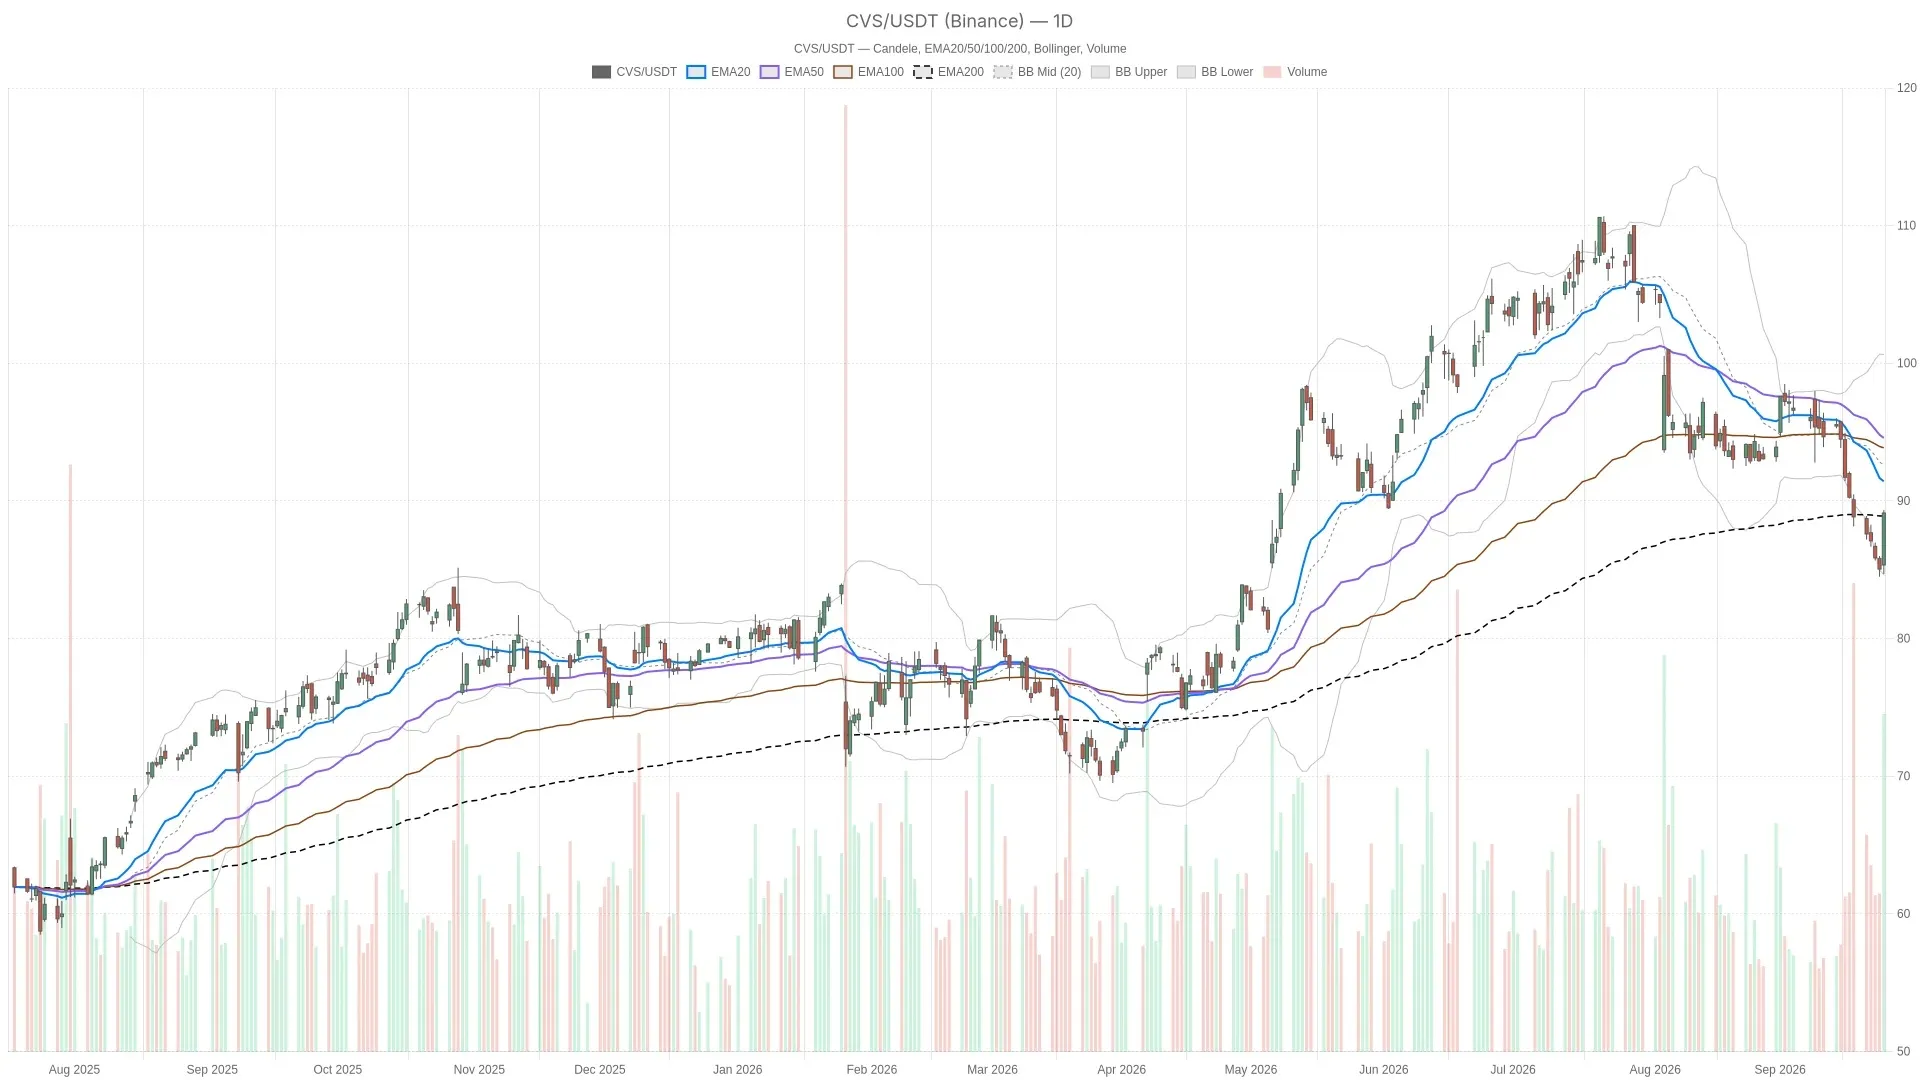
CVS Health Corporation stock Analysis: Mixed Signals After 4.8% Surge
CVS — daily chart with candlesticks, EMA20/EMA50 and volume.Key takeawaysCVS Health Corporation stocksurged 4.8% on September 25, closing at $89.13 and reclaiming the 200-day EMA at $88.91.The daily trend remains bearish, with price still below the 20-day EMA at $91.42and the 50-day EMA at $94.58.Daily RSI14 at 40.05and a negative MACD histogram at -0.55confirm the broader downtrend is intact.Hourly momentum has flipped bullish with a MACD crossover, though RSI14 at 69.03now nears overbought territory.Key levels to watch: R1 resistance at $90.75and S1 support at $86.10, framing the immediate decision zone. CVS Health Corporation stocksurged 4.8% on September 25, closing at $89.13 after eight consecutive losing sessions. The rally reclaimed the 200-day EMA and the daily pivot. Yet the broader technical picture remains unresolved—a violent bounce inside a still-bearish trend structure. Daily Chart: A Bounce Inside a Downtrend The daily chart shows CVS Health Corporation stockbouncing sharply within a broader downtrend that remains structurally intact. CVS opened at $85.35 and closed at $89.13, with a session high of $89.35 and low of $84.70. The stock reversed off its lower Bollinger Band at $84.63, near the days low. Meanwhile, the upper band sits far away at $100.64 and the midline at $92.64, highlighting the wide