WLD Price Prediction: Brief Rally to $0.30 Before $0.20 Breakdown

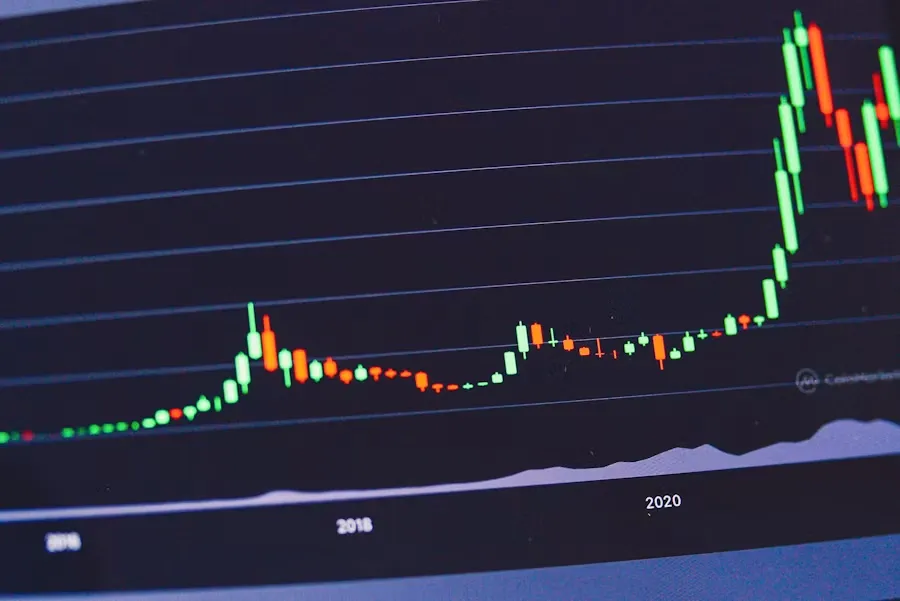
Market Context: Why WLD is Moving Now  Worldcoin trades at $0.24 after surrendering 51% from its 200-day moving average at $0.49, exhibiting textbook bear market characteristics. Todays modest 1.09% uptick represents typical oversold relief rather than meaningful reversal, with the token dangerously close to its Bollinger Band lower boundary at $0.22.  The middle Bollinger Band at $0.26 now acts as formidable resistance, creating a technical ceiling that will likely cap any short-term recovery. Negative funding rates of -0.0265% reveal persistent institutional short pressure, while the tokens proximity to critical support levels suggests further downside vulnerability remains the primary concern.  Technical Picture Breakdown  WLDs RSI sits at 39.23, trapped in neutral territory but unable to generate sustained buying momentum despite oversold conditions. The MACD histogram rests at absolute zero, signaling complete momentum stagnation that typically precedes either explosive moves or continued drift lower.  The cascading moving average structure tells the real story. The 7-day SMA matches current price at $0.24, while the 20-day SMA at $0.26 creates immediate overhead resistance. This configuration forces any relief rally to fight through multiple technical barriers, making sustained upward movement highly improbable without significant catalysts.  Derivative Market Intelligence  Open interest surged 4.07% to $43.4 million while funding rates turned negative, indicating sophisticated

05-05Industry

Bank groups challenge Senator Thom Tillis over stablecoin proposal

U.S. banking groups have pushed back against the latest CLARITY Act language on stablecoin rewards, arguing it does not sufficiently prevent risks to bank deposits.U.S. banking groups have said the CLARITY Acts updated language still allows stablecoin rewards that could pull deposits from traditional banks.Trade associations warned that incentives tied to balances or holding periods may replicate deposit-like returns despite the proposed ban on yield.Lawmakers including Senators Thom Tillis and Angela Alsobrooks have defended the compromise as a path forward, even as disagreements with banks continue.  According to a joint statement from the American Bankers Association, Bank Policy Institute, Consumer Bankers Association, Financial Services Forum, and Independent Community Bankers of America, the revised provisions tied to stablecoin yield “fall short” of preventing deposit flight despite efforts by lawmakers to address the issue.  The groups said Senators Thom Tillis and Angela Alsobrooks are “seeking to achieve the correct policy goal,” though the current draft does not fully close gaps tied to reward structures.  Banks warn of deposit outflows despite yield restrictions  Concerns raised by the banking coalitions focus on how the proposal restricts interest-like payments on idle stablecoin balances while still allowing transaction-based incentives. The groups said such incentives, if linked to balance size, duration,

05-05Industry

Dogecoin Sees Big-Money Interest: Whales Load Up On 160M DOGE

Tech  Dogecoin Sees Big-Money Interest: Whales Load Up On 160M DOGE  On-chain data shows the Dogecoin whale supply has noted an uptick recently, a sign that big-money accumulation interest in the memecoin has gone up.  Dogecoin Whales Have Bought 160 Million DOGE In Just 96 Hours  As highlighted by analyst Ali Martinez in an X post, the Dogecoin whales have participated in net buying recently. “Whales” here refer to the large investors of the cryptocurrency holding a significant number of tokens in their wallet balance.  Thanks to their large holdings, this cohort can carry some degree of influence in the market. As such, its behavior can often be worth keeping an eye on. Even if it may not directly impact the assets price, it can still contain hints about the sentiment among these humongous entities.  Now, here is the chart shared by Martinez that shows the recent trend in the supply of the Dogecoin whales:  As displayed in the above graph, the Dogecoin whale supply has observed a jump recently. In total, the whales loaded up on 160 million DOGE (worth about $17.7 million) inside a 96-hour window during this accumulation spree.  The buying from the whales has interestingly come after a significant price surge. While the amount

05-05Industry

Assessing ZENs bullish market structure - How long will momentum hold now?

Tech  Assessing ZENs bullish market structure – How long will momentum hold now?  Horizen (ZEN) has started the week with a sharp bullish move, climbing by 12% over the last 24 hours as buyers regained clear control of the short-term price action.  The rally followed a fresh bullish structure shift on the daily chart. Such a shift often marks the first meaningful sign that momentum may be beginning to rotate back in favour of buyers.  This shift matters more than the daily gains themselves as the price had been compressing before the breakout. However, the latest move pushed ZEN beyond that short-term structure and confirmed a change in market direction – Evidence of momentum expansion.  Open Interest surge – A sign of stronger conviction?  One of the clearest signs supporting the rally has been the sharp rise in Open Interest. Over the last 24 hours, ZENs Open Interest climbed by 24% to $19.2 million, tracking closely with the price hike.  In the past, similar alignments have hinted at fresh capital entering the market rather than a move driven by short covering alone. In simple terms, traders are not just reacting to the breakout. Instead, they may be adding exposure to it.  This behaviour lends the current rally more

05-05Industry

Symbiosis Integrates KyberSwap Aggregation to Revolutionize Cross-Chain Liquidity and Pricing

Symbiosis Finance has announced a major strategic integration with KyberSwap which will improve the performance of all cross-chain (DeFi) transactions. The partnership is a key milestone in Symbiosis‘ efforts to enhance the performance of on-chain swaps and routing in the ecosystem and will utilize KyberSwap’s cutting-edge aggregation protocol to offer globally competitive pricing and significantly enhanced liquidity.  Empowering DeFi with KyberSwaps Aggregation  The aggregation engine that is being used within KyberSwap is where this integration truly begins. KyberSwap allows Symbiosis to utilize more than 420 different liquidity providers on over 17 different blockchains to provide its users with on-chain swap capabilities through internal routing. This extensive liquidity pool provides Symbiosis users with very low slippage on trade executions, including high volume and long-tail assets that typically experience fragmented markets.  KyberSwap‘s smart routing algorithm will scan different decentralized exchanges (DEX) in real time to find out the best ways to execute trades. For Symbiosis’ users, this means that they can trade and re-route transactions across multiple pools in order to get the best rates without losing speed or security of the protocol.  Enhancing the One-Click Cross-Chain Experience  Symbiosis has developed a “single tap” UX that lets the users transfer assets cross-chain with minimal effort and ease

05-05Industry

Equities: Tech rotation holds despite risk-off tone – Danske Bank

Tech  Equities: Tech rotation holds despite risk-off tone – Danske Bank  Danske Research Team notes that global equities fell, with the S&P 500 down 0.4% and Stoxx 600 off 1% on Iran-related headlines. The session was characterized as de-risking, with most sectors lower except tech and energy. Defensive sectors outperformed, and software stocks gained 2%, leading the team to argue that the latest tech stock rotation remains strong and is likely to continue.  Risk-off session still favors technology  “Equities were lower yesterday. S&P 500 -0.4% and Stoxx 600 -1% in a volatile session, characterized by Iran headlines. This was a de-risking session in equities, with almost all sectors lower but tech and energy.”  “Defensive stocks outperformed, including health care and tech while industrials, materials and consumer discretionary sold off ~-1%. It is interesting to see tech outperforming even in a defensive session like yesterday, especially as yield were materially higher.”  “This mix would easily have made the tech the worst performing sector three months ago. Instead, software stocks even bounced 2% yesterday, outperforming the market by a meaningful 3pp.”  “This says something about the strength of the latest tech stock rotation. As our readers will know, we see it continuing. ”

05-05Industry

Euro extends losses on concerns of an open US-Iran war

EUR/USD is showing a growing bearish momentum, with price action nearing the support area between 1.1645 and 1.1675, which has held downside attempts several times in April.  Momentum indicators are deepening within bearish territory. The 4-hour Relative Strength Index (RSI) dives to around 40, while the Moving Average Convergence Divergence (MACD) drifts into negative territory with a mildly bearish tone, suggesting that upside attempts may continue to struggle.  The mentioned support area above 1.1645, however, is likely to pose a significant challenge for bears. A clear break below that area would confirm a bearish Head & Shoulders pattern, with a measured target just below April lows in the 1.1500 area.  On the upside, Fridays low, at 1.1715, might act as resistance ahead of the April 20 and May 1 highs in the area between 1.1785 and 1.1795, and the April 17 high, near 1.1850.

05-05Industry

USD/JPY: Upside capped after intervention – TD Securities

Finance  USD/JPY: Upside capped after intervention – TD Securities  TD Securities strategists see USD/JPY consolidating around 157.00 in Q2 2026 after the recent Japanese Ministry of Finance (MoF) intervention triggered a 3% drop. They argue that markets now treat 160.00 as a line in the sand, capping upside and deterring fresh longs, while the pair is expected to retrace pre‑intervention levels more slowly than in past episodes.  Consolidation with 160.00 acting as cap  “USD/JPY dropped 3% last Thursday on MoF intervention.”  “With markets now treating 160.00 as an implicit line in the sand, the upside in USD/JPY looks increasingly capped, which should deter speculators from re-engaging in long USDJPY.”  “We also expect it to take longer to retrace back to pre-intervention levels than in prior episodes: historically, the MoF has leaned against speculative, volatile moves rather than defending a precise spot level.”  “After last weeks JPY intervention, path of least resistance for USD/JPY is likely a consolidation around our Q2 forecast of 157.00.”

05-05Industry

Moscow Exchange bets bigger on crypto with SOL, XRP, TRX and BNB indexes

Moscow Exchange plans to publish four more crypto indexes from May 13, widening its benchmark list beyond Bitcoin and Ethereum.MOEX will add SOL, XRP, TRX and BNB indexes from May 13 for professional investors.Binance will supply 50% of pricing data, while Bybit, OKX and Bitget provide the rest.Existing Bitcoin and Ethereum indexes will update every 15 seconds during trading and weekend sessions.  The new indexes will track Solana, XRP, Tron and BNB under the tickers MOEXSOL, MOEXXRP, MOEXTRX and MOEXBNB.  The exchange plans to calculate prices with data from Binance, Bybit, OKX and Bitget. Binance will carry a 50% weight. Bybit will provide 20%, while OKX and Bitget will each provide 15%.  Crypto benchmarks move closer to live pricing  From May 13, Moscow Exchange also plans to update all digital currency indexes more often. Existing benchmarks, including MOEXBTC and MOEXETH, are expected to update every 15 seconds during trading hours and extra weekend sessions.  The shift may make the benchmarks more useful for products tied to digital asset prices. However, the exchange has not presented the new altcoin indexes as tradable products yet. It said they “could become” underlying assets for future instruments, leaving timing and terms open.  Meanwhile, the planned indexes fit Russia‘s controlled route

05-05Industry

US 30-Year Yield Hits Highest Yield in Two Decades as Iran War Reignites Inflation Fears

The US 30-year Treasury yield has surged past 5%, nearing its highest level in roughly two decades as the Iran war raises inflation fears.  The 30-year yield is now 8 bps away from a new 18-year high. pic.twitter.com/UQgGB4AGiL  — Jim Bianco (@biancoresearch) May 4, 2026  Notably, yields rose across the curve. Yesterday, the 2-year and 10-year notes each climbed more than 6 basis points. The 30-year added 5 basis points, while the 10-year hit a 9-month high.  Bond Rout Deepens as 30-Year Yield Pierces Key 5% Level  According to the Global Markets Investor, the 5% mark on the 30-year has acted as a ceiling for two years. It was tested in late 2023 and early 2025, but failed to sustain above this level both times.  The post added that the S&P 500 pulled back whenever yields approached or exceeded 5%. A sustained break above 5% would push yields into territory unseen in nearly two decades. The 2023 peak near 5.17% sits as the next major test.  “At 5%, government bonds become attractive enough to pull capital away from equities, while simultaneously raising borrowing costs for mortgages, corporate loans, and US government debt,” Global Markets Investor added.  The Iran conflict has accelerated the move. Higher oil prices threaten to

05-05Industry
1
...
716718
...
1000