Solana Price Prediction: SOL Stuck Below Key Resistance
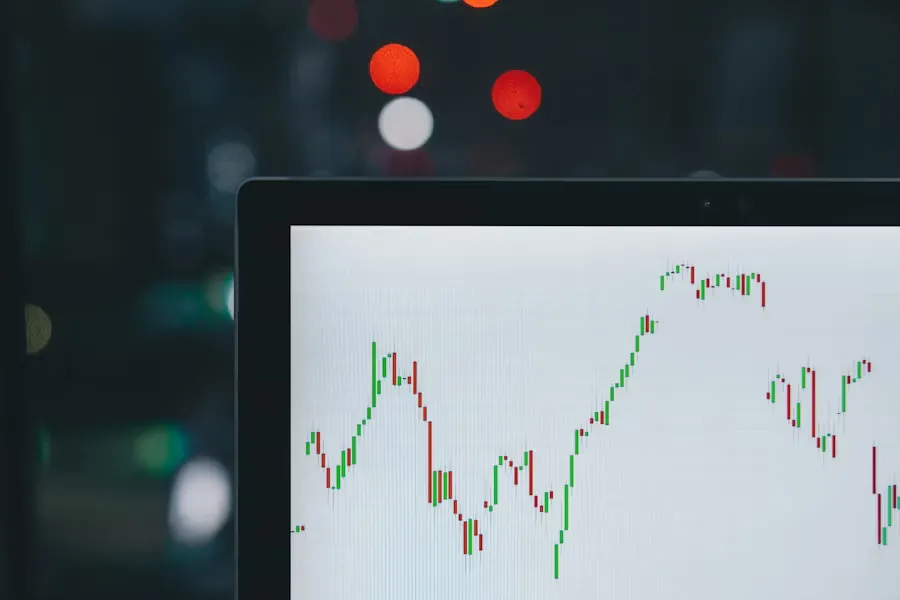
Solana is still trapped below $100, but two charts show the same pressure point building. Analysts say a clean breakout could shift SOL from a four month range toward higher targets, with $100 acting as the first major test. Solana Price Chart Shows Breakout Setup as Analyst Targets $100 Solana is trading inside a breakout setup after holding a consolidation range and pressing against a long descending trendline, according to a three day chart shared by CryptoCurb on X. The analyst said a Solana breakout is coming and pointed to $100+ as the next key upside area. Solana Breakout Chart. Source: The chart shows SOL forming a base after a long decline from its previous highs. Price moved sideways inside a green consolidation zone before reaching the descending blue trendline. That trendline has acted as resistance during the broader pullback. A clean move above it would mark a stronger breakout signal and could shift attention back to the $100 area. CryptoCurb also compared Solana‘s structure with NEAR’s recent chart. The NEAR chart shows a similar pattern, with price building a base below a descending trendline before breaking higher. The comparison suggests the analyst expects SOL to follow a similar path. The projected bars on the Solana chart point