Bitcoin's Spot-Backed Rally Hides an Altcoin Leverage Trap Last Seen in 2025
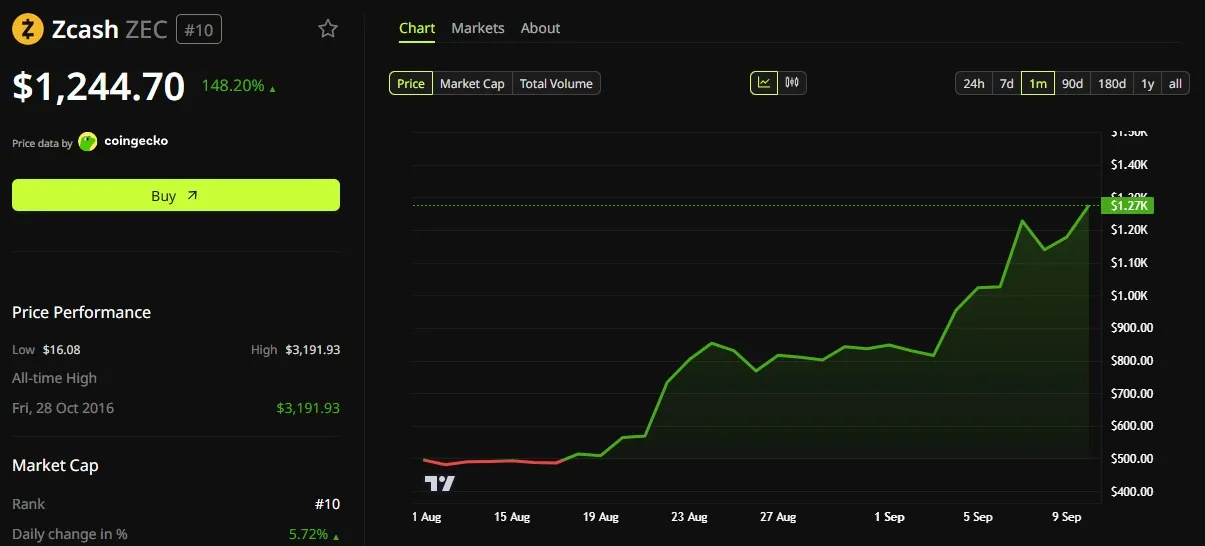
Altcoin perpetual futures carried more open interest than Bitcoin‘s on September 6, the first such flip since December 2024, according to Coinalyze data. That crossover comes even as Bitcoin’s own rally stays anchored in spot demand, not altcoin leverage. Neoclassic Capital Co-Founder and Managing Partner Michael Bucella called Bitcoins advance a healthy rotation. He said the initial surge came from short covering. Spot demand and rising call-option skew have since taken over as futures positioning eased. Altcoin Leverage Nears Levels Last Seen Before 2025s Crash Zcash drove most of the shift. ZECs derivatives book swelled to an all-time high near $2.4 billion during Zcashs decade-high rally. Short sellers absorbed roughly $34 million in forced closures as the token broke higher. Discover more News Distributed s Spot-Backed Rally Hides an Altcoin Leverage Trap Last Seen in 2025 appeared first on BeInCrypto.