Ripple price today Analysis: 24h Bias Bearish, Key Levels
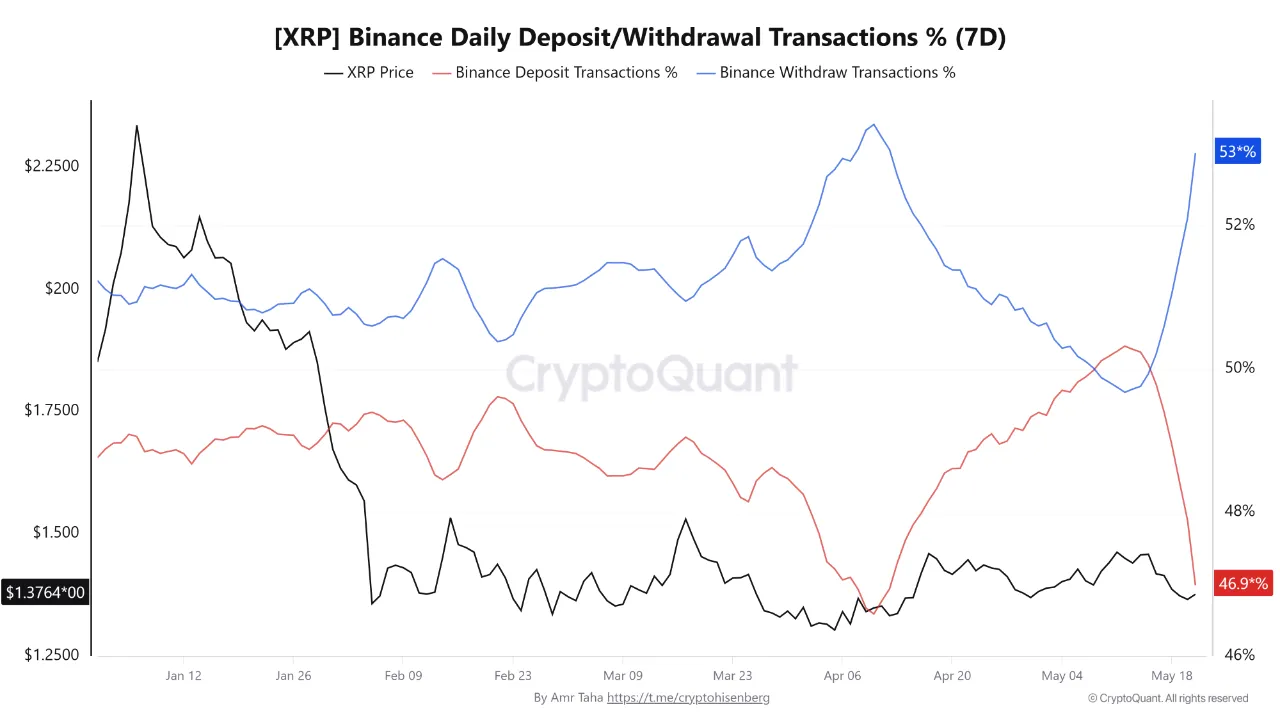
XRP/USDT — daily chart with candlesticks, EMA20/EMA50 and volume.Main bias and market logic Meanwhile, price is pinned near the daily pivot in a cautious, cash-heavy market. With Bitcoin dominance around 58% and a Fear mean reversion dominates until a clean push through $1.38–$1.39 or a slip below $1.36. Additionally, micros are flat around $1.37 with a very tight realized range. Expect liquidity sweeps around $1.36–$1.38; the first break after this compression tends to run stops. Indicator evidence (D1 unless noted) RSI (14): 42.83 Overall mildly bearish and below the midline, signaling sellers have the edge but no exhaustion extremes; there is room for continuation or a bounce. MACD: line -0.01, signal 0, histogram -0.01 Similarly, momentum is flat to negative; pressure tilts down, but no strong impulse is present. The next directional push can develop quickly from here. EMAs: 20D = 1.40, 50D = 1.41, 200D = 1.73; price = 1.37 Price sits below all trend filters, with the 20 under the 50, a classic bearish structure that favors selling strength into 1.40–1.41. Bollinger Bands: mid 1.41, upper 1.48, lower 1.34 As a result, trading in the lower half near the mid-to-lower corridor keeps risk skewed; a break outside 1.34/1.41 can travel. ATR (14): 0.05 Consequently, daily movement is roughly 3–4%; volatility is