A bitcoin pattern taking shape right now could send prices soaring to $76,000
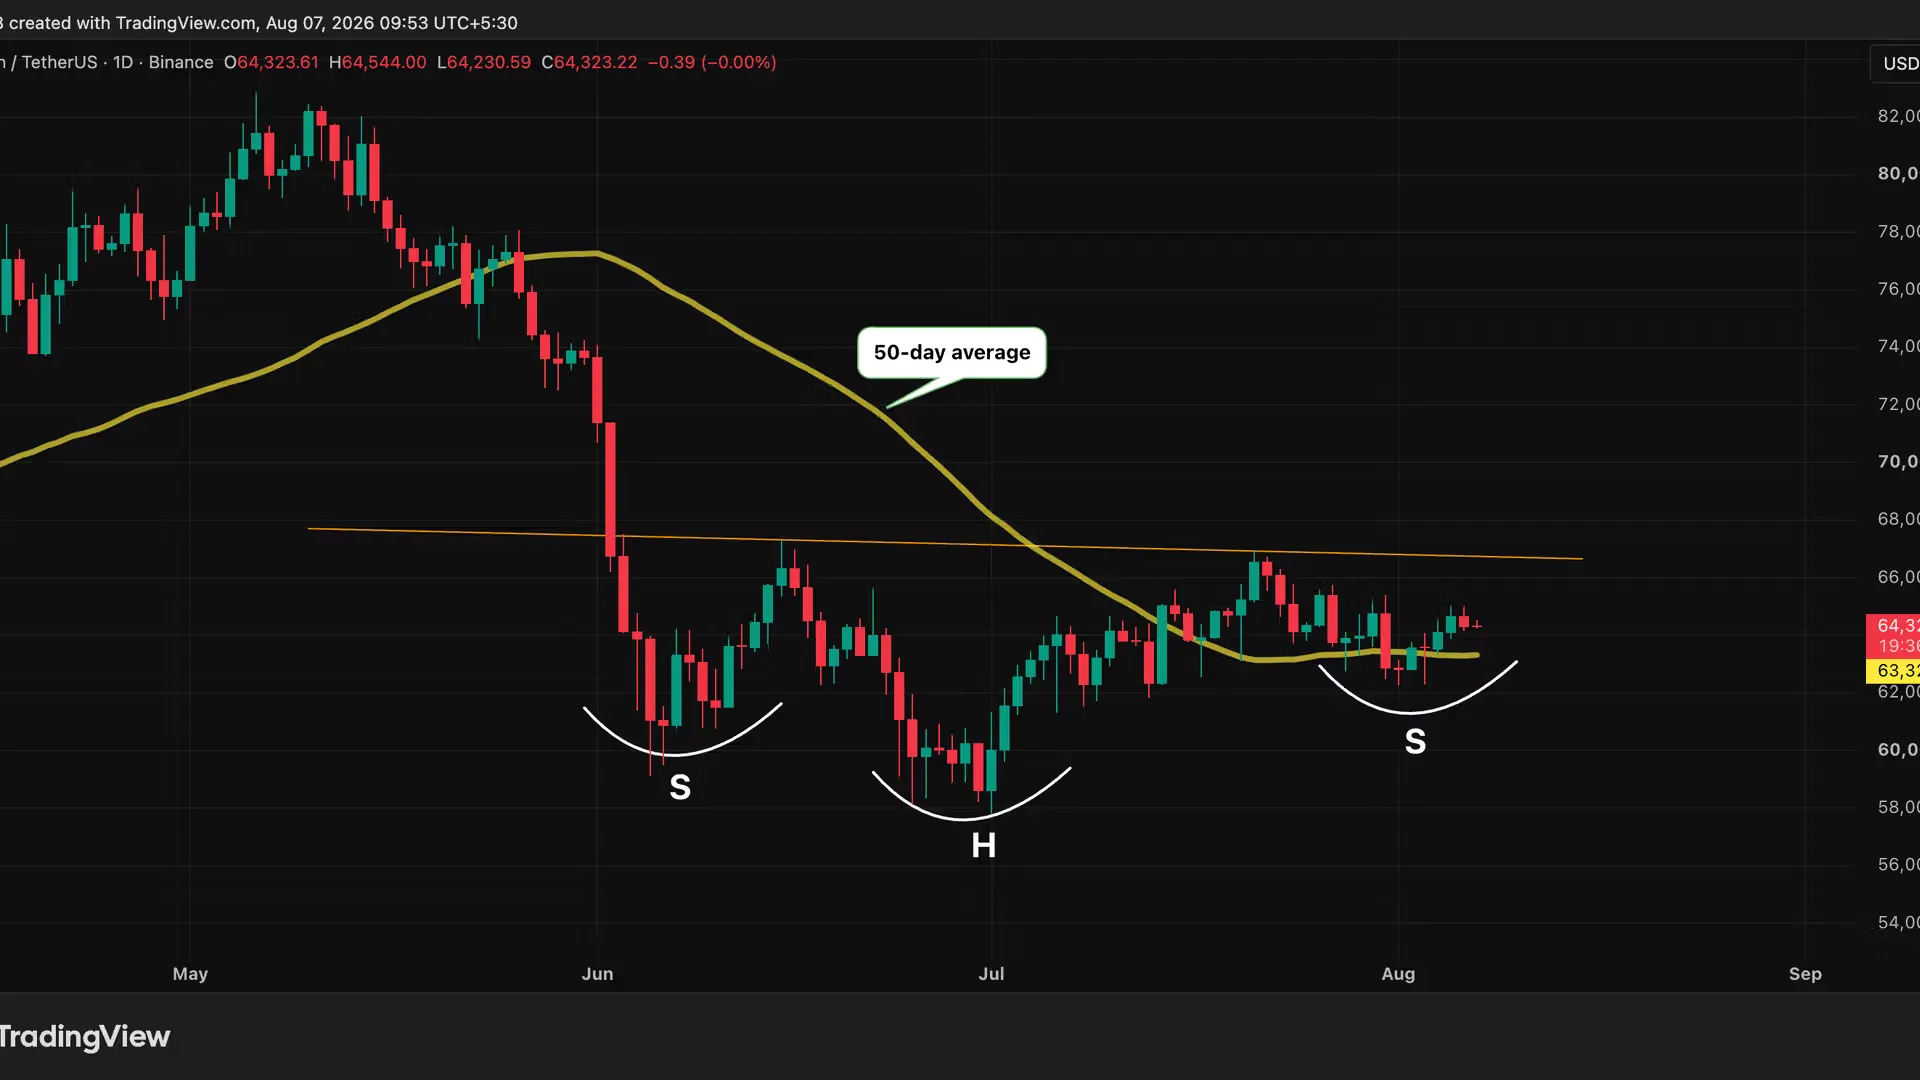
SummaryBitcoins price is tracing out a potential bullish inverse head-and-shoulders patter on the daily chart.Prices could rise to $76,000 if the pattern is triggered.The pattern isnt confirmed yet. Chart reading remains subjective, and the Clarity Act uncertainty is a reason to watch for renewed weakness below the 50-day average. Bitcoins recent price action has been unremarkable and boring, the kind that sends traders looking for excitement elsewhere. But look closer, through a technical analysts lens, and the token appears to be hammering out a bullish pattern, which, if confirmed, could suggest a rally to $76,000. That pattern is the popular inverse head-and-shoulders (Hs daily chart: a low near $60,000 in early June formed the left shoulder, a deeper trough near $57,700 in late June or early July marked the head, and the recent bounce from around $62,500 formed the right shoulder. Each trough was followed by a rebound toward a similar resistance zone.