Crypto Market Rockets to $2.73T as Fed Rate Hike Fears Evaporate
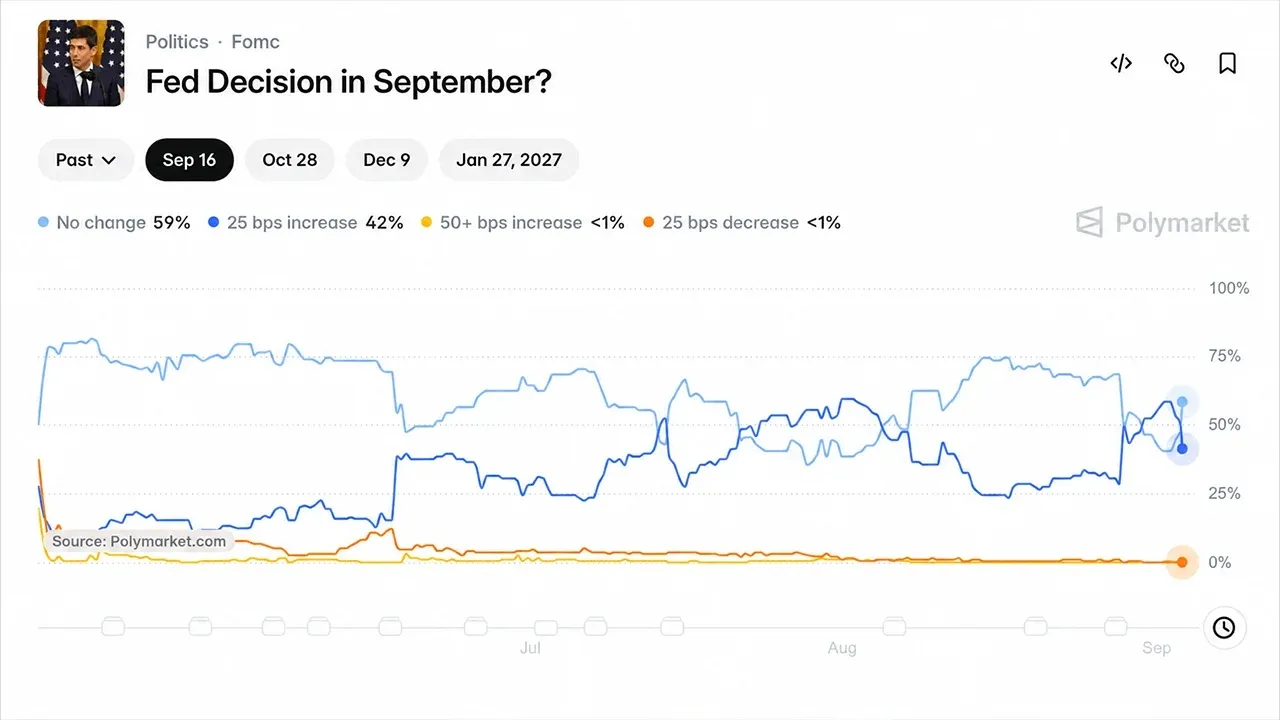
The crypto markets overall valuation turned sharply higher Thursday, pushing its total value to $2.73 trillion as fading expectations for another Federal Reserve rate increase sent traders piling back into digital assets. Key TakeawaysCryptos market value hit $2.73 trillion as Fed rate fears eased Thursday.ZIG jumped 18.75% and ZEC gained 18.06% as altcoins lit up across the board.Crypto traders now turn to Sept. 11 CPI ahead of the Feds Sept. 15-16 meeting. The move stretched across the broad market rather than staying concentrated in one corner. Bitcoin climbed roughly 4.8% and touched $81,364, while ethereum moved back above $2,500, solana reclaimed $104, BNB traded around $720 and XRP jumped roughly 8% to 9% toward $1.46. Fed Rate Bets Flip and Crypto Traders Pile Back In Federal Reserve Gov. Christopher Waller provided the spark after signaling that cooling inflation could convince him to support keeping the federal funds rate at its current 3.50% to 3.75% range when policymakers meet Sept. 15-16. The reaction stretched well beyond crypto. Polymarket odds of a September rate increase fell from roughly 59% Wednesday to 42% following Wallers remarks, while Treasury yields eased and gold gained about 2%. Crypto assets quickly joined the broader risk-on move. Lower expectations for another rate increase