Strive rallies 5.8% as it clears debt in Q1, unveils daily dividends
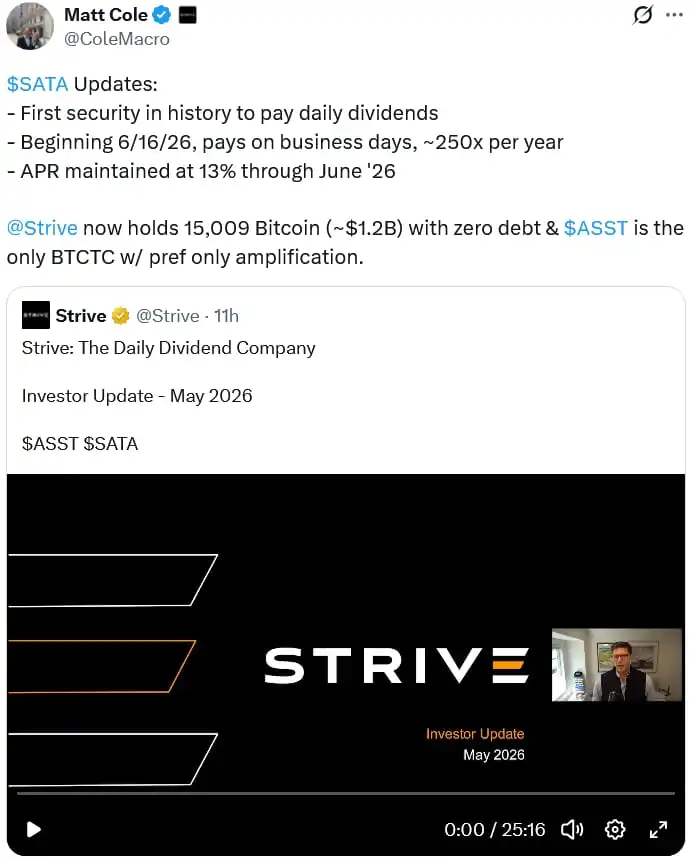
Shares in Bitcoin-focused Strive closed 5.8% higher on Thursday after the company said it will become a “Daily Dividend Company” and revealed it eliminated all debt in the first quarter of 2026. The Vivek Ramaswamy-founded company said the Variable Rate Series A Perpetual Preferred Stock, ticker SATA, will start paying dividends every business day beginning June 16 at a current annual dividend rate of 13%. The payouts are funded by income generated from the companys Bitcoin treasury strategy. Strive CEO Matt Cole said the move will make it the first public company to offer daily dividends, expanding on a similar playbook adopted by Michael Saylors Strategy, which has relied on perpetual preferred stock offerings such as Stretch (STRC) to fund its Bitcoin purchases while paying investors every two weeks. “The rate at which innovation is happening in the digital credit space is fascinating to behold,” said Bitcoin For Corporations contributor Adam Livingston. Strategy executive chairman Michael Saylor called the daily dividends “impressive.” Strives daily dividends mark another example of a Bitcoin treasury firm moving beyond a simple buy-and-hold strategy to remain competitive in the bear market. This comes as Strive reported an unrealized net loss of $265.9 million for Q1. The company attributed the loss