How Low Can XRP Price go After Falling Below $1.30?

XRP (XRP) price dropped to $1.26 on Thursday, its lowest in over 16 weeks. A bearish technical setup suggested that the pressure may extend into June.  Key takeaways:XRPs bear pennant pattern breakdown on the weekly chart targets $0.63.XRP social sentiment hit a three-week low, while Net Unrealized Profit/Loss data shows rising fear and investors underwater.  XRP price bear pennant breakdown underway  XRP has been displaying several bottoming signals, including a falling MVRV ratio and rising XRP Ledger activity, which suggested that the price was .  The latest drop, however, has seen the XRP/USD pair drop below this zone to enter the breakdown phase of its bear pennant setup, as shown on the weekly chart below.  XRP has dropped below the pennants lower trendline at $1.35, opening the way for a deeper move toward the measured target of the prevailing chart pattern at $0.63, a 50% drop from the current price.  XRP became “structurally bearish” with the latest breakdown below $1.30, analyst Egrag Crypto in a Thursday post on X, adding:  “The bearish targets are $1.27, $1.1 and a possible capitulation wick toward $0.88.”  Technical analyst ChartNerd that after breaching the support line at $1.30, the path is now clear for a drop toward $1 “sooner rather than later.”  As

05-29Industry

BlackRock Outflows Trigger 'Golden Era' for Bitcoin

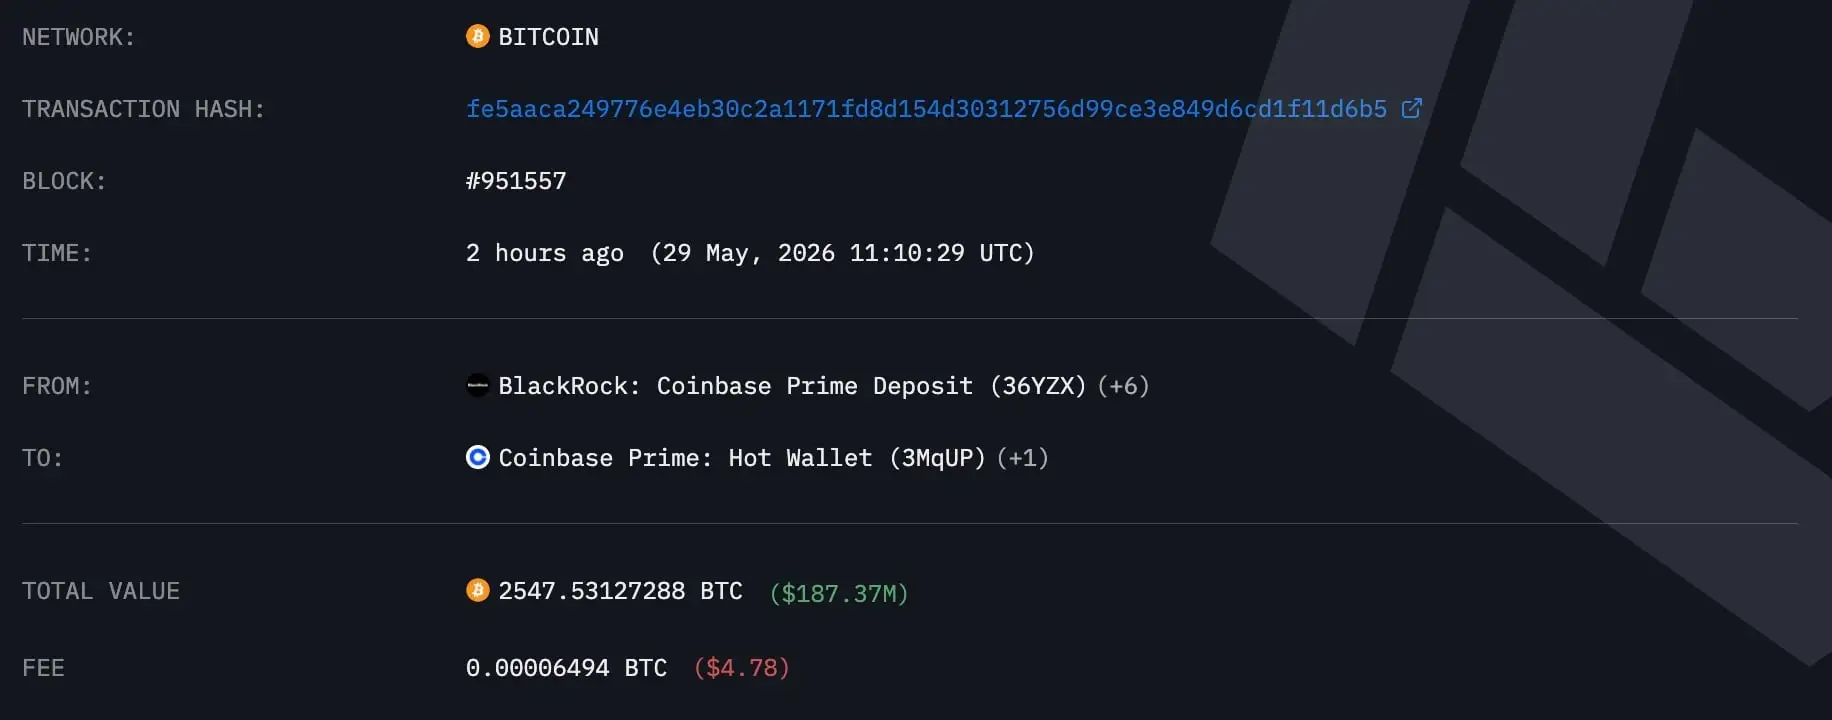
Large-scale capital outflows from U.S. crypto funds have continued for the ninth consecutive day and show no sign of stopping. Just before the start of the May 29 trading session, investment giant BlackRock transferred another large batch of assets worth 2,448 $BTC valued at $180 million to Coinbase Prime, according to Arkham.  As is already clear by the end of the month, institutional players are taking profits out of ETFs because of the Feds restrictive policy and U.S. Treasury yields at 5.20%. However, this prolonged sell-off unexpectedly exposed a tectonic change, as Bitcoin volatility fell to the level of defensive precious metals, specifically gold.  BlackRocks transaction with Bitcoin to Coinbase as of May 29, 2026, Source: ArkhamHow Bitcoin vaults toward gold status for Wall Street  According to the latest data from the Bloomberg terminal, the 60-day historical volatility of the Bitcoin fund IBIT fell to 34.177%. At the same time, volatility in the gold ETF GLD rose to 27.227% amid geopolitical tensions. This makes the gap between the fluctuations of $BTC and physical metals narrow to a record low of just 7%.  For Bloomberg senior ETF analyst Eric Balchunas, this exact factor determines the long-term viability of cryptocurrency, although it is completely ignored in

05-29Exchange

Bitcoin price at crossroads as bearish setup points to more losses

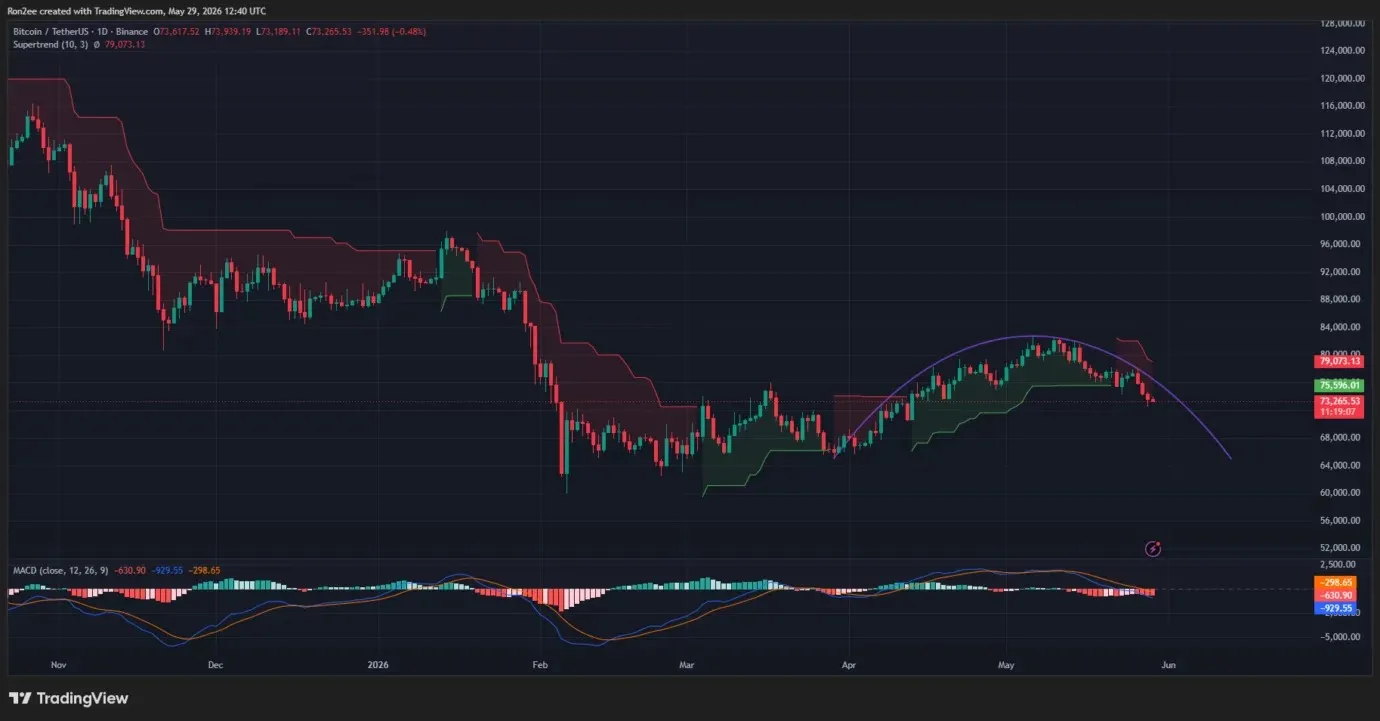
Bitcoin has stabilized near $73,000 after a three-day slide, but bearish chart signals suggest the correction may not be over.  According to data from crypto.news, Bitcoin ($BTC) price was trading around $73,200 at press time, recovering modestly after briefly falling toward the $72,600 region on May 28. The decline erased more than 10% from Bitcoins May peak near $81,000 and came as investors rushed out of risk assets amid fears of a wider conflict in the Middle East and renewed concerns over the global economy.  Sentiment improved slightly on Friday after reports suggested U.S. and Iranian negotiators were working toward a memorandum of understanding that could extend the ceasefire by 60 days and reopen shipping routes through the Strait of Hormuz. The development helped stabilize oil prices and reduced some of the panic selling that had weighed on crypto markets throughout the week.  The geopolitical shock arrived as U.S. spot Bitcoin ETFs recorded one of their largest withdrawal streaks of the year. More than $733 million exited the products on May 27 alone, with BlackRocks IBIT reportedly accounting for over $500 million of the total. Such redemptions force ETF issuers to sell underlying Bitcoin holdings, adding direct spot-market supply during periods of weak

05-29Exchange

Micron Stock Analysis: 3 Key Levels as MU Stalls Below 950

MU — daily chart with candlesticks, EMA20/EMA50 and volume.Daily Technical Outlook for Micron StockTrend and Momentum  On the daily timeframe, MU closed at 923.52 after a 904.78–949.49 range. EMAs are stacked and rising: EMA20 735.53, EMA50 603.02, and EMA200 382.42. Therefore, the primary trend is decisively higher and extended above medium‑ and long‑term averages.  RSI14 sits at 75.68. Momentum is hot and overbought, which raises near‑term pullback risk without breaking the trend. Meanwhile, MACD prints 94.76 versus a 81.31 signal with a 13.45 histogram, keeping upside momentum positive and the bull case intact.  Bands, Volatility, and Pivots  Bollinger Bands show a mid at 728.77, an upper at 950.46, and a lower at 507.08, with price settling just beneath the upper band. However, the advance is stretched toward resistance, making follow‑through tougher without fresh fuel.  ATR14 is 67.98, indicating wide daily swings. Daily pivots sit at PP 925.93, R1 947.08, and S1 902.37, with price a touch below the pivot. Therefore, resistance is tight into 947 while first meaningful support tracks around 902.  Intraday Context: 1‑Hour Chart for MU  On the 1‑hour chart, the regime stays bullish but the thrust is fading. Price closed at 923.52, above EMA20 900.57, EMA50 838.18, and EMA200 682.02. Interpretation: the intraday trend

05-29Industry

Bitcoin whale expands long position to $94M, but BTC remains bearish

Bitcoin  Bitcoin whale expands long position to $94M, but BTC remains bearish  With the market on its back foot, investors, especially whales on the derivatives, were forced to reposition themselves.  Garret Jin adds Bitcoin long to $94 millionSource: CoinGlassBitcoin derivatives remain bearishSource: CryptoQuant  Source: CryptoQuantIs $70k support at risk?  Bitcoins downside momentum strengthened further, largely due to the long squeeze over the past day. In fact, the negative index (-DI) jumped to a monthly high of 29.  At the same time, its positive index dropped to 12 while the ADX sat around 14. With ADX and -DI above +DI, this suggests the downtrend is extremely strong.  Source: TradingView  Historically, when this momentum indicator is set this way, it has signaled a higher likelihood of trend continuation. Therefore, if the pressure holds and Futures whales show risk-off sentiment, Bitcoin could drop to $70,500.  However, if the market cools down and excessive leverage is flushed out, BTC could see a healthy reset. In doing so, the market could rebound above $75k, setting a path for a clear recovery.

05-29Industry

Strategy Moves $30 Million in BTC to Coinbase Amid Sell Speculation

The timing of the deposit raised eyebrows given recent hints that Strategy could consider selling some of its Bitcoin.  On May 29, the worlds largest corporate holder of Bitcoin Strategy transferred 411.48 BTC, worth over $30 million, to Coinbase Prime, a move that immediately drew attention across the crypto community as traders tried to read the intent from the on-chain activity.  The timing was especially hard to ignore considering that on Polymarket, the probability that Strategy will sell some of its Bitcoin before December 31, 2026 has now hit 84%.  What the Transfer Could Mean  Depositing BTC to an exchange does not automatically mean that the holder is looking to sell. This was noted by pseudonymous crypto analyst COINBOY, who pointed out that funds moved to Coinbase Prime could be for OTC trading, collateral arrangement, or institutional fund management rather than outright liquidation. Keep that distinction in mind before reading too much into a single on-chain transaction.  However, what gave Strategy‘s move more weight is the context around it, with the company’s Executive Chairman Michael Saylor recently declining to rule out selling some BTC before year-end, a notable departure from the hold-at-all-cost image hes spent years building.  That change in mindset was revealed period. During the

05-29Industry

Texas Names Bitcoin Reserve Advisory Committee As State Eyes Direct Bitcoin Custody

Bitcoin  Texas Names Bitcoin Reserve Advisory Committee As State Eyes Direct Bitcoin Custody  Acting Texas Comptroller Kelly Hancock on Thursday announced the members of the Texas Strategic Bitcoin Reserve Advisory Committee, a newly created body tasked with guiding the states management, custody, and valuation of bitcoin holdings.  The committee was established under Senate Bill 21, passed by the 89th Texas Legislature and signed into law on June 22, 2025 — making Texas one of the most prominent states in the nation to move forward with an operational bitcoin reserve.  “The Legislature gave the Comptrollers office a clear responsibility to administer the Texas Strategic Bitcoin Reserve, and that work must be done with transparency, security and strong financial controls,” Hancock said in a statement Thursday. “This advisory committee brings together the kind of expertise needed to help the state carry out that direction carefully, responsibly and in the best interest of Texas taxpayers.”  JUST IN: ???????? Texas announces the creation of the “Texas Strategic Bitcoin Reserve Advisory Committee.”  Texas is now also looking for a qualified firm to custody their BTC for when they buy more ???? pic.twitter.com/fbkps1IS6T  — Bitcoin Magazine (@BitcoinMagazine) May 29, 2026  The five-member committee — which includes Hancock himself — draws on a broad range

05-29Industry

Solana price must hold $80 support to fuel next leg higher: analyst

While the token remains well below the 0.236 Fibonacci retracement level near $111 and the weekly Supertrend resistance around $121, the $79-$80 support area has continued to attract buyers during repeated selloffs.  According to analysts at More Crypto Online, Solana could decline toward $62 if it fails to hold the key $72–$78 support zone. Conversely, a rebound above the May 12 high near $98 could pave the way for a move toward the $110 level.  Institutional sentiment toward Solana has remained mixed. Reports that Goldman Sachs liquidated its Solana ETF exposure earlier this year removed a notable source of institutional demand, while several asset managers continue pursuing crypto-related investment products tied to major layer-1 networks.  Traders have increasingly focused on whether fresh institutional participation emerges if market conditions stabilize during the second half of the year.  What technical risks could invalidate the bullish thesis?  The daily chart presents a more cautious picture. Solana price recently formed a bearish double-top pattern after failing twice near the $98 resistance area, first in March and again in May. The structure developed as momentum weakened across the recovery rally and sellers repeatedly defended the same overhead resistance zone.  Solana price has formed a double top pattern on the daily chart

05-29Industry

Ethereum price risks $2,000 breakdown as leverage flashes warning

Ethereum  Ethereum price risks $2,000 breakdown as leverage flashes warning  Ethereum is trading near a key price zone as weak momentum, high leverage, and heavy sell-side flow shape short-term market action.Ethereum trades near $2,006 as RSI stays weak and price struggles around key support.Binance open interest rose 336,000 ETH while taker selling hit -$744 million, CryptoQuant data showed.Analysts remain split as weak momentum clashes with leverage that could fuel volatility ahead.  The crypto.news price data showed ETH near $2,006, with the token holding close to the $2,000 area after recent weakness.  Ethereum price remains under pressure near $2,000  Ethereums short-term setup remains fragile as price action stays close to the $2,000 level. The token has struggled to rebuild strength after recent declines, while buyers have not yet pushed ETH back above the higher range.  Ethereum 24-hour range stood between $1,972.57 and $2,023.22. This keeps ETH close to a support area that many traders now watch.  Trading volume stood near $13.17 billion, while market capitalization was around $242 billion. That shows activity remains active, but it does not yet point to a clean recovery.  The main concern is that ETH has not reclaimed the $2,200 zone. A move back above that area would show better demand. A break below

05-29Ethereum

Weekly Close Could Determine Whether Ethereum Will Cost $1,000

Ethereum  Weekly Close Could Determine Whether Ethereum Will Cost $1,000  The current weekly close will determine whether Ethereum (ETH) falls toward the $1,000 mark, according to a technical analysis by analyst Ali Martinez. According to his data, a weekly candle close below the key $1,850 support will trigger an acceleration of selling.  If this level is broken, the first target of the downward move will be the intermediate support near $1,560, while the final point of the decline within the multiyear channel will be the lower boundary of the range near $1,070.  Ethereum ETF outflows meet an “Amazon 2001” analogy  The decline in the price of the main altcoin is taking place amid the continued flight of institutional capital. U.S. spot Ethereum ETFs recorded a net outflow of $121 million, marking the thirteenth consecutive day of withdrawals and signaling sustained bearish sentiment among Wall Street investors.  Is Saylor Selling? Strategy Moves $30 Million in Bitcoin  Ripples Schwartz Mocks Audacious $286 Billion Bitcoin Lawsuit  Additional pressure on the market came from the actions of Bankless co-founder David Hoffman, who fully liquidated his ETH position on May 26, 2026, after nine years of holding. Hoffman said the token had already reached fair value and had lost its upside potential, as

05-29Industry
1
...
673675
...
1000