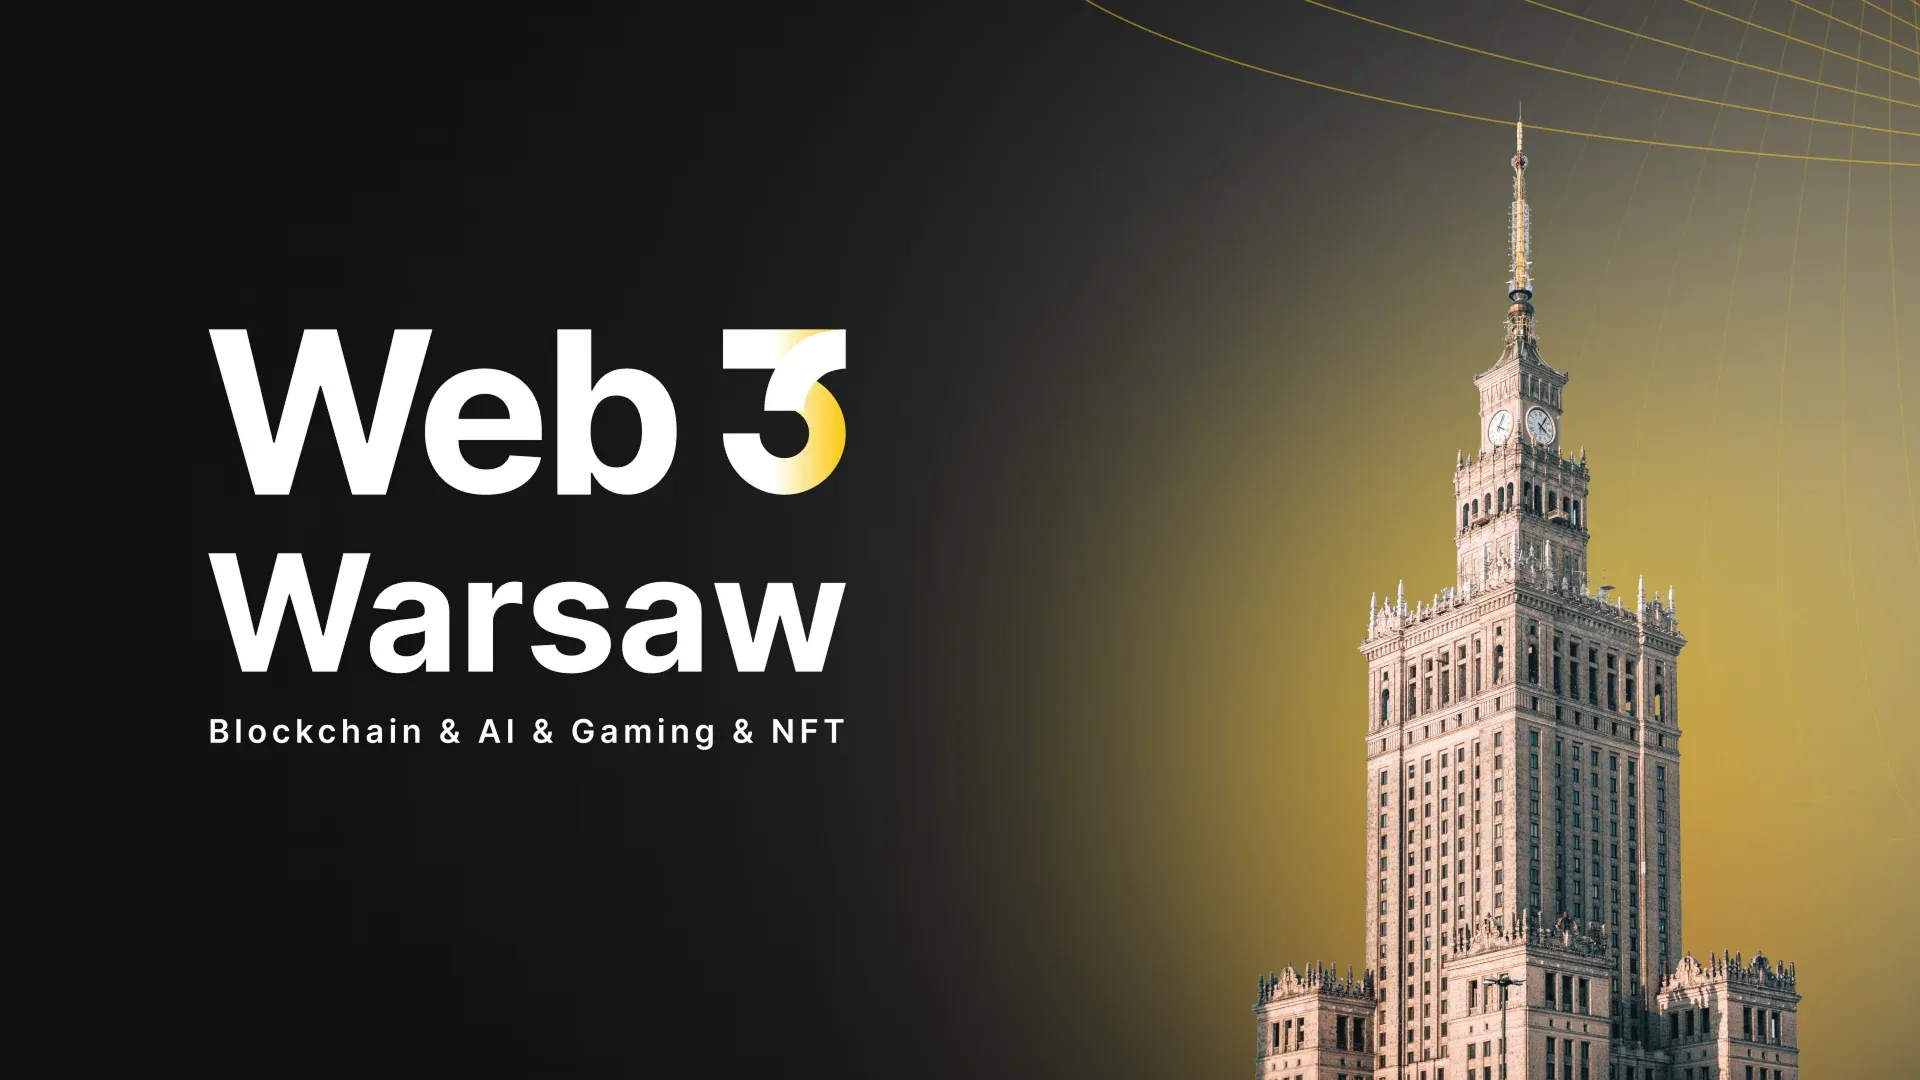
Web3 Warsaw 2026 Returns as Eastern Europes Largest Blockchain Conference, Uniting 5,000+ Builders, Founders, and Investors This September
Web3 Warsaw 2026 Returns as Eastern Europes Largest Blockchain Conference, Uniting 5,000+ Builders, Founders, and Investors This September Web3 Warsaw 2026, the largest blockchain and technology conference in Eastern Europe, will take place on September 9–10, 2026 in Warsaw, Poland, anchoring Blockchain Week Warsaw. Billed as the most inclusive blockchain conference, the event continues to cement its place as a leading meeting point for the global Web3 community, connecting the innovators, leaders, and ideas shaping the digital future. This years edition is scaling significantly, with organizers expecting 5,000+ attendees, 300+ speakers, and 100+ exhibitors spanning Tech, NFT, Gaming, and AI. The conference unites startups, enterprises, researchers, and experts to exchange knowledge, showcase solutions, build partnerships, and drive sustainable innovation across global markets and emerging digital ecosystems. A multi-track, two-day program Content will run across four themed stages, with sessions delivered in both English and Polish to welcome the local Polish community alongside attendees from across Europe and the wider global ecosystem. Beyond the main programming, Web3 Warsaw 2026 offers a packed experience:Hackathon— developers build, compete, and innovate while tackling real-world Web3 challengesAwards Night— celebrating exceptional startups, visionary founders, and the industrys best service providers50+ Side Events— curated gatherings running throughout Warsaw Blockchain Week, giving