Ripple price today Analysis: August 6 Market Stalls Near Support
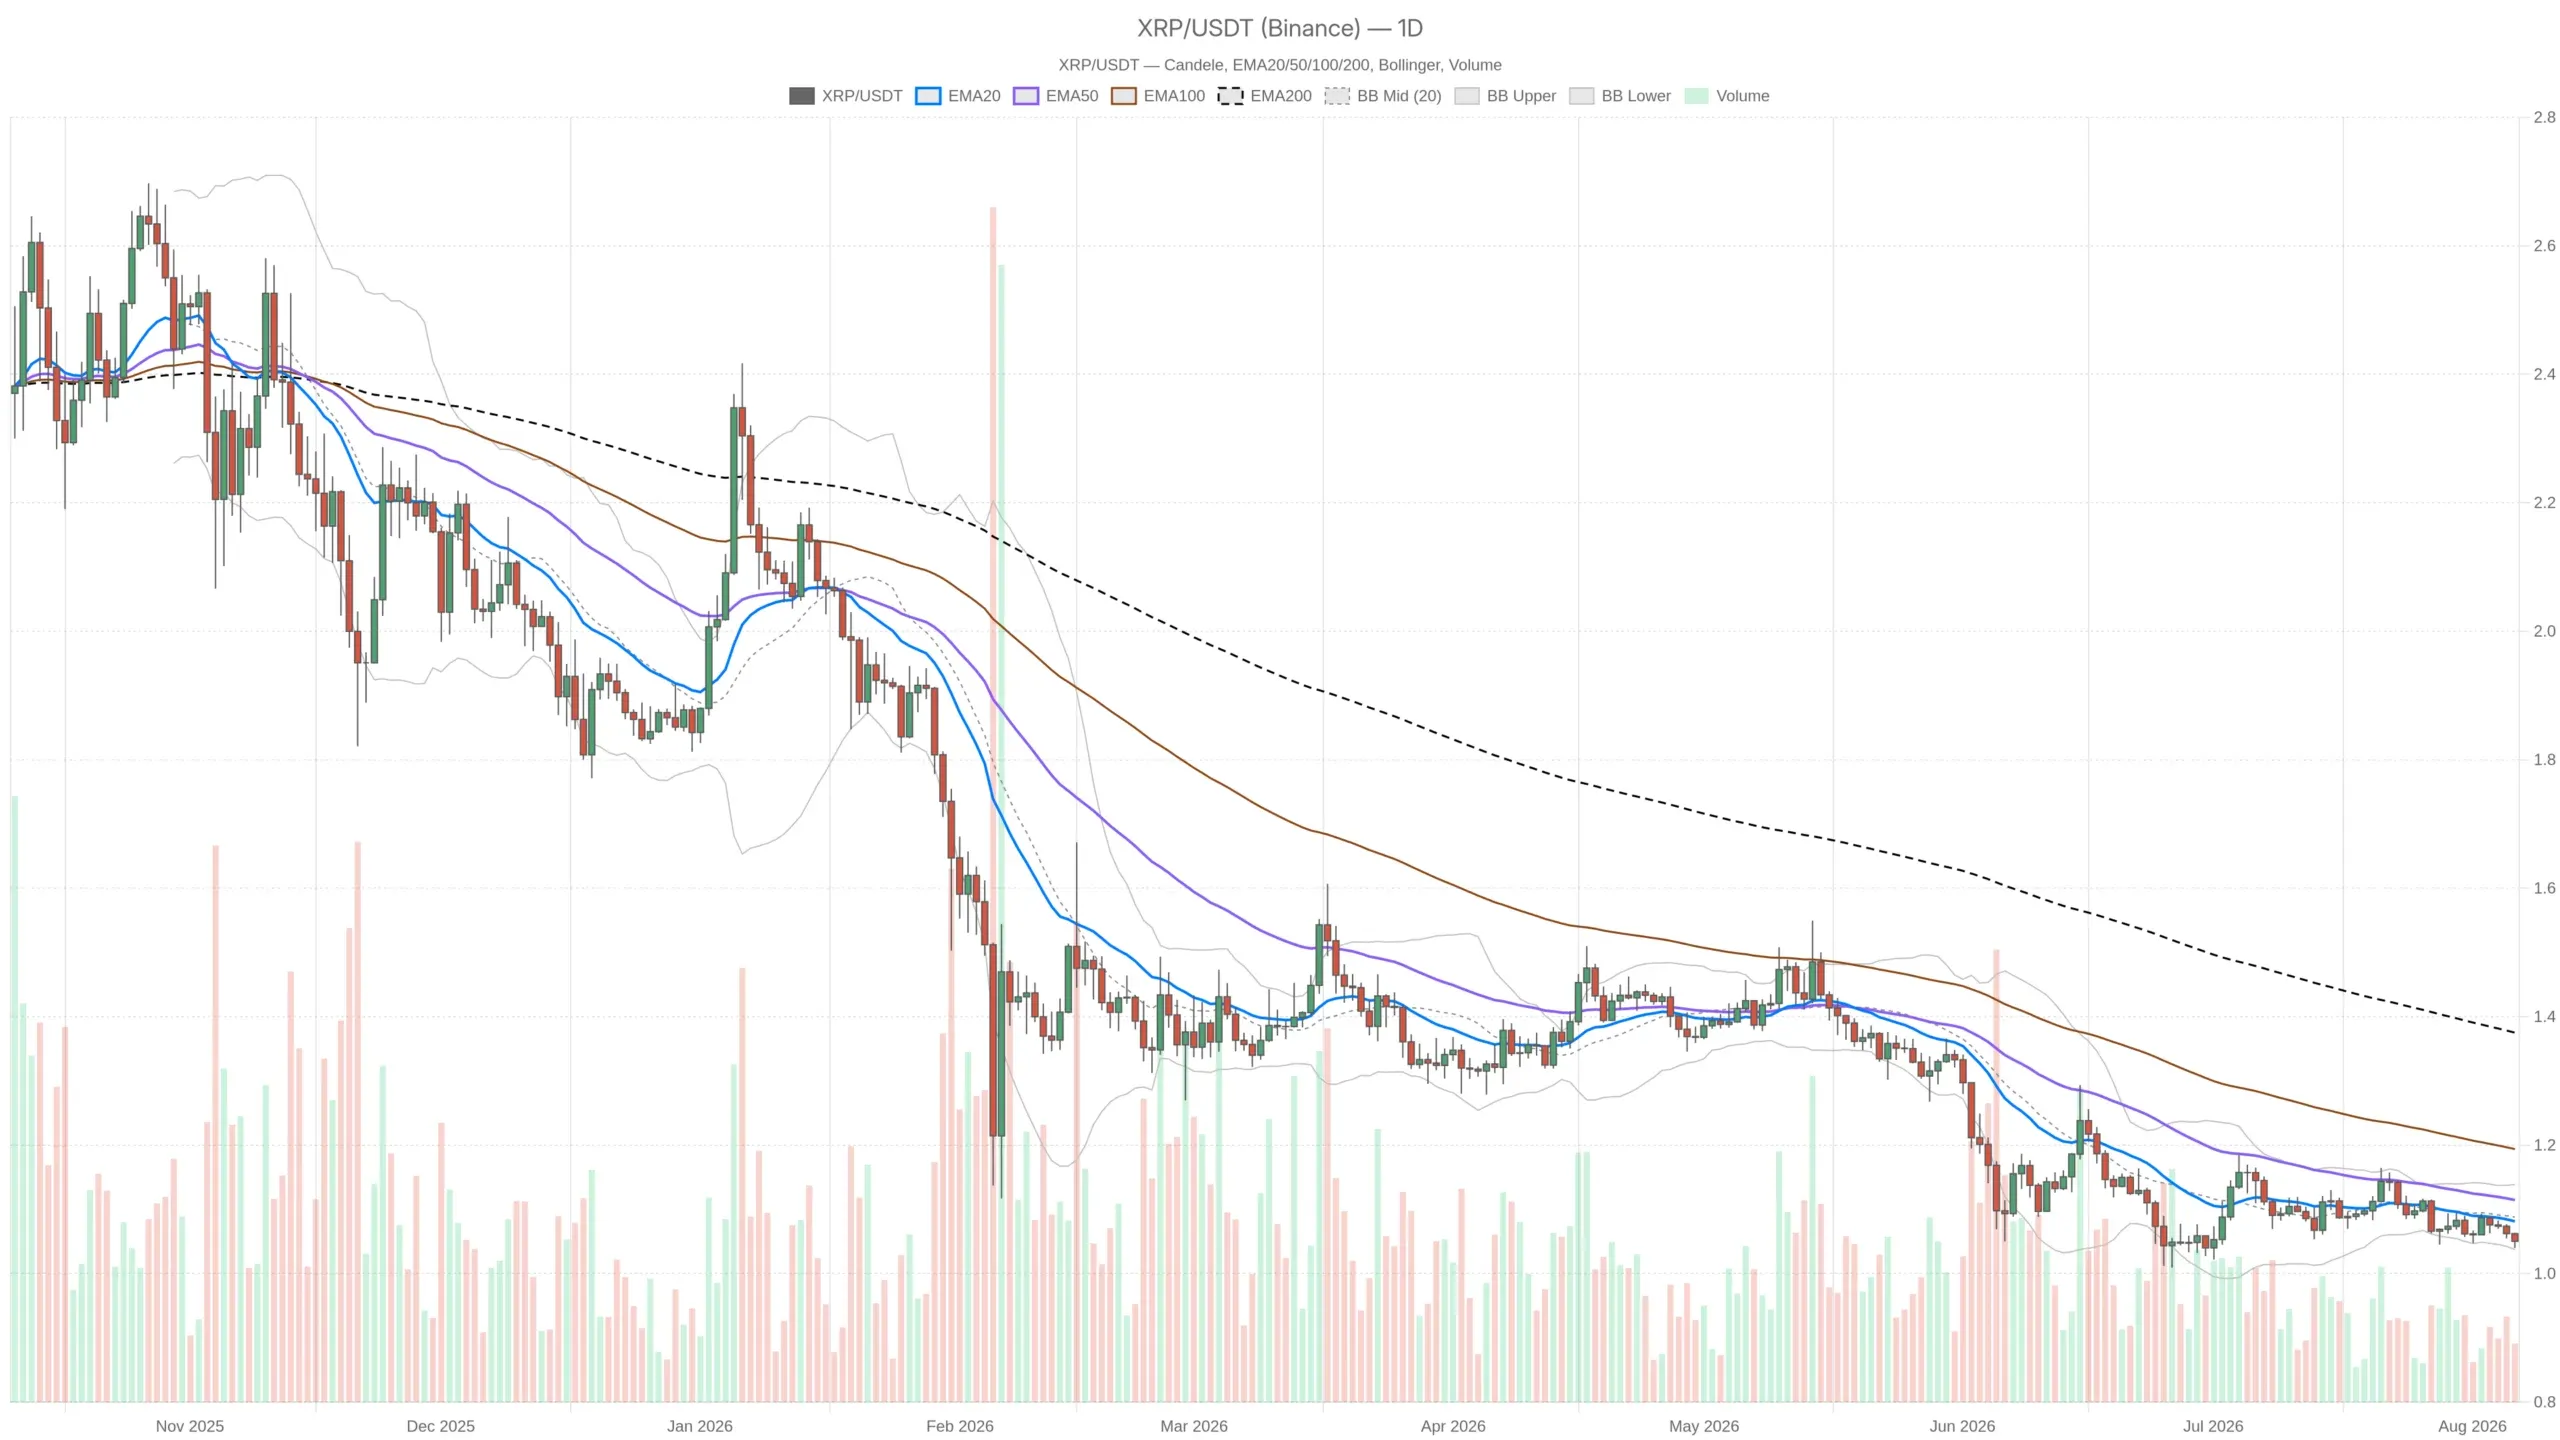
The crypto market remains in a defensive posture, with XRP caught in a low-conviction holding pattern. As of August 6, 2026, the Ripple price today sits at $1.05, resting on the daily pivot and just above the lower Bollinger Band — a spot that signals indecision more than trend. XRP/USDT — daily chart with candlesticks, EMA20/EMA50 and volume.Key takeawaysXRP trades at $1.05on August 6, 2026, sitting near the lower Bollinger Band at $1.04Daily EMAs are stacked bearishly: price below 20-EMA ($1.08), 50-EMA ($1.11), and 200-EMA ($1.38)Fear & Greed Index at 25signals Extreme Fear across the crypto marketBTC dominance at 56.7%shows capital remains concentrated in BitcoinThe $1.04–$1.06 range is the critical zone for the next directional signal The dominant force right now is defensive positioning, not aggressive selling or buying. Bitcoin dominance is parked at 56.7%, according to CoinGecko figures, which means capital is still concentrated in BTC rather than rotating into XRP or other majors. Total crypto market cap sits around $2.29 trillion, up a modest 0.8% over 24 hours. The broader market is not collapsing — it is simply not interested in XRP specifically. Layer on a Fear & Greed reading of 25 (Extreme Fear), and you get a picture of